AQA A-Level Economics | 4 Mark Question
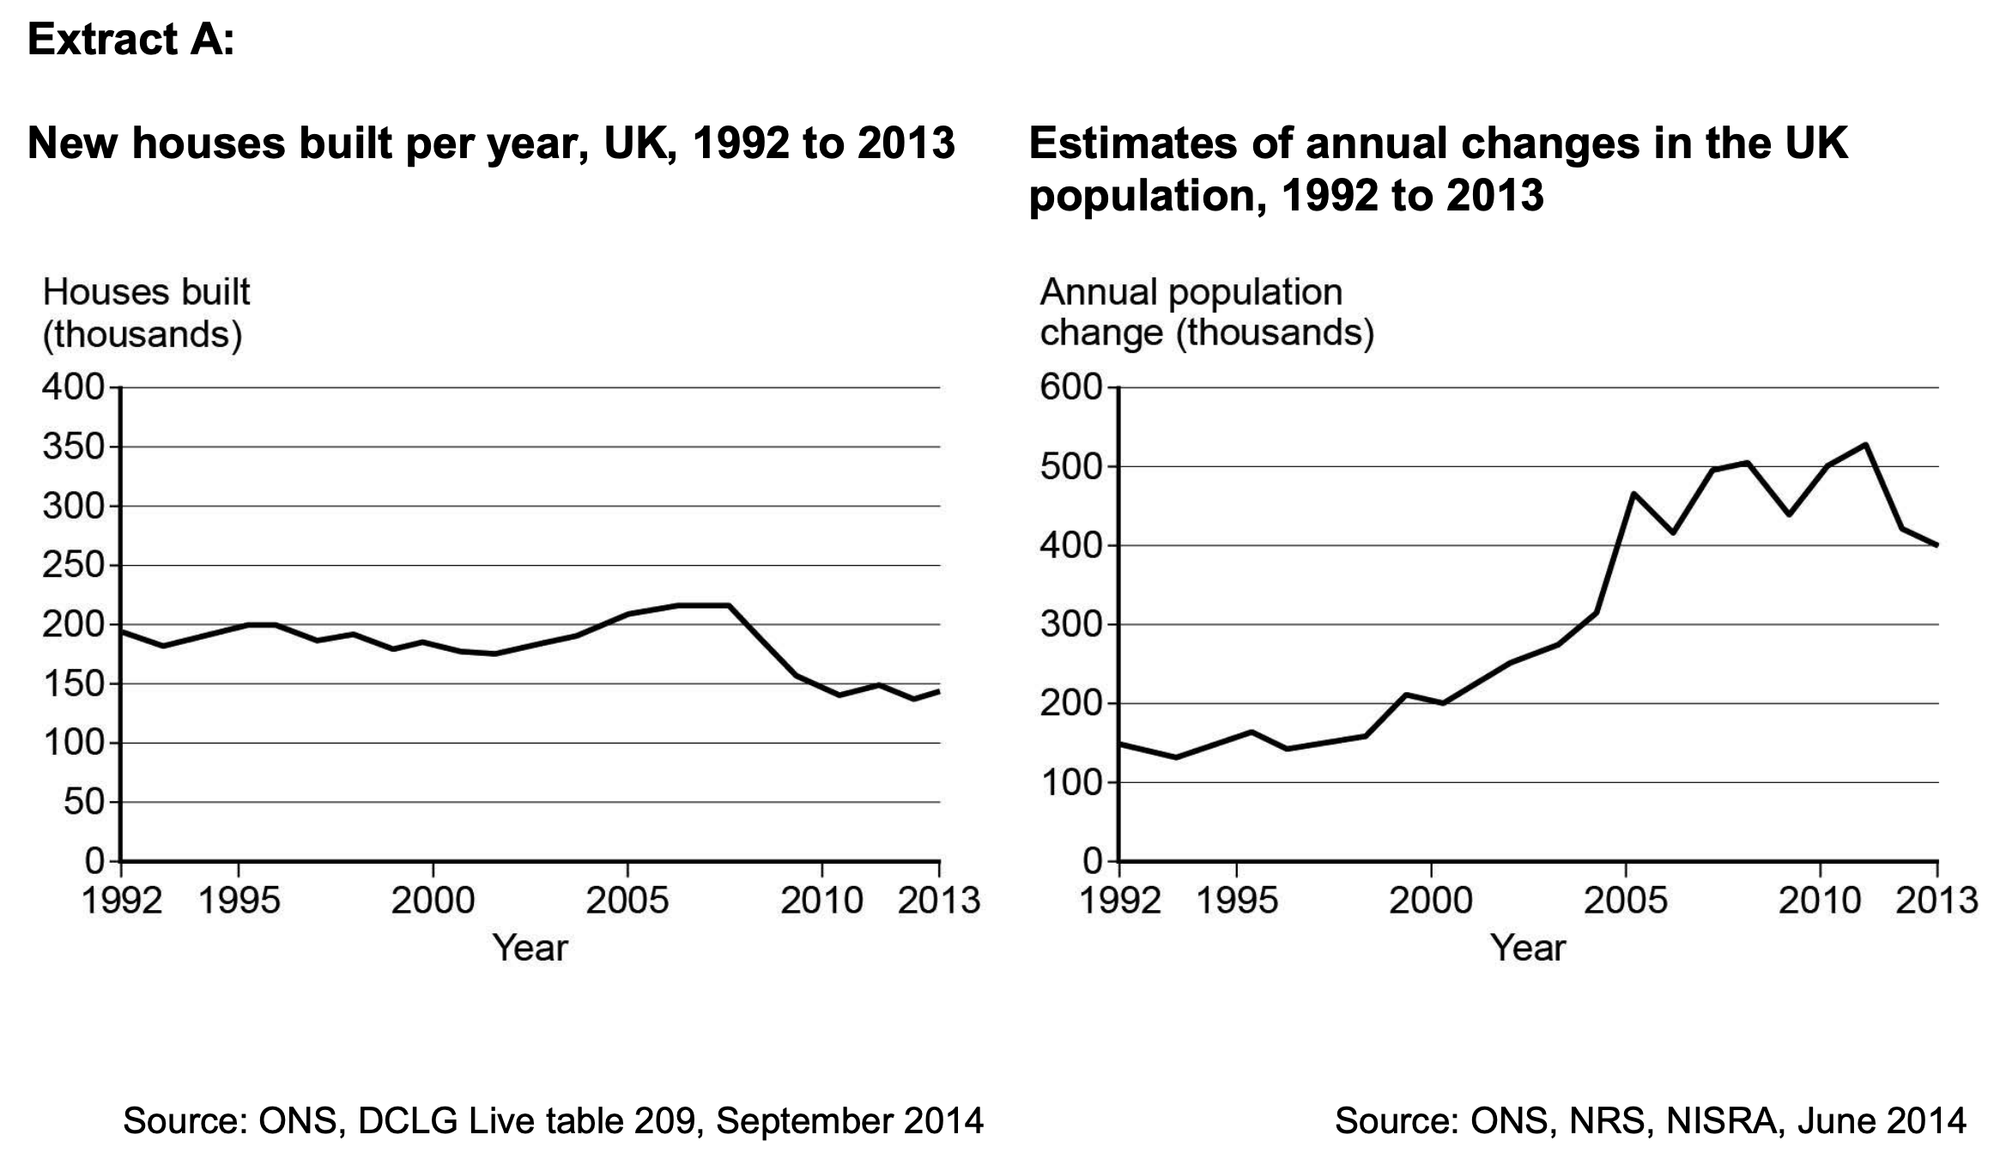
Use Extract A to identify two significant points of comparison between the number of new houses built per year in the UK and the changes in UK population over the period shown (June 2016)
- Overall the number houses built each year has fallen but the annual population change has increased
- For example, the number houses built went from 195,000 in 1992 to 145,000 in 2013 but the population increased by 150,000 in 1992 but increased by 400,000 in 2013.
- The peak for the annual population change was in 2011 but the peak for the number of houses built was in 2007. In 2011, the annual population change was 520,000 and in 2007 there were 220,000 houses built.
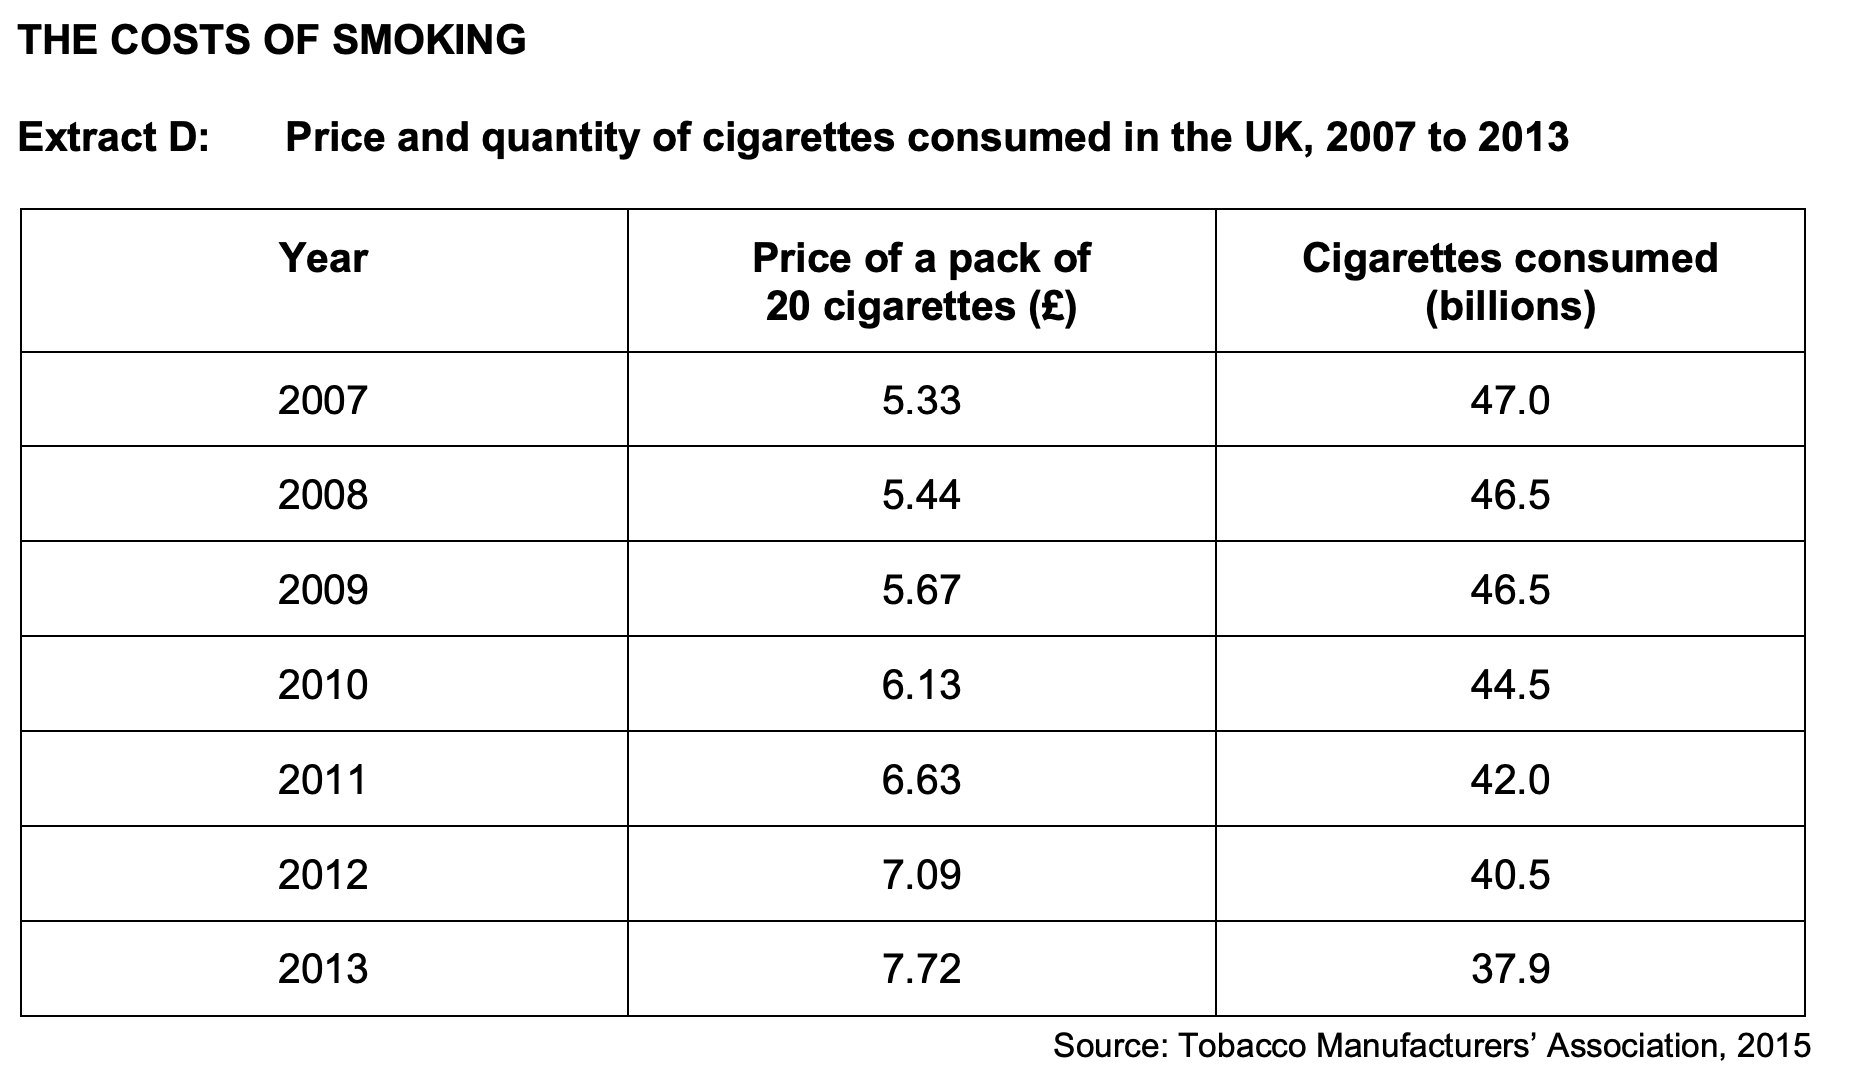
Use Extract D to identify two significant points of comparison between the price and the quantity of cigarettes consumed in the UK from 2007 to 2013 (June 2016)
The prices of cigarettes increased overall and the quantity of cigarettes consumed decreased overall. The price increased from £5.33 per pack in 2007 to £7.72 per pack in 2013, whilst the quantity consumed fell from 47 billion in 2007 to 37.9 billion in 2013.
From 2008 to 2009, this was the only time there was no change in cigarettes consumed (47 billion to 47 billion). During this time, the price of cigarettes still increased from £5.44 to £5.67 per pack.